 |
 |
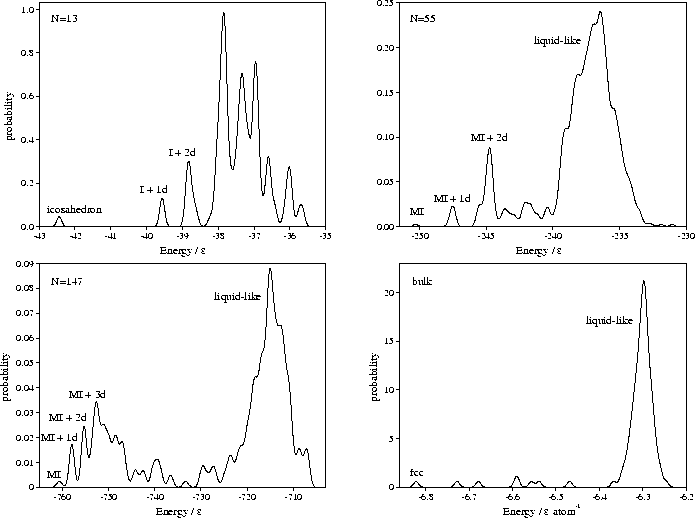
The four distributions of minima obtained are shown in Figure 4.3.
The geometries of the local minima were subsequently reoptimized for ascending and descending
integer values of ![]() .
For the bulk material, the box size was scaled at each value of
.
For the bulk material, the box size was scaled at each value of ![]() to keep
the energy of the fcc minimum at a constant fraction of its zero-pressure energy.
On changing
to keep
the energy of the fcc minimum at a constant fraction of its zero-pressure energy.
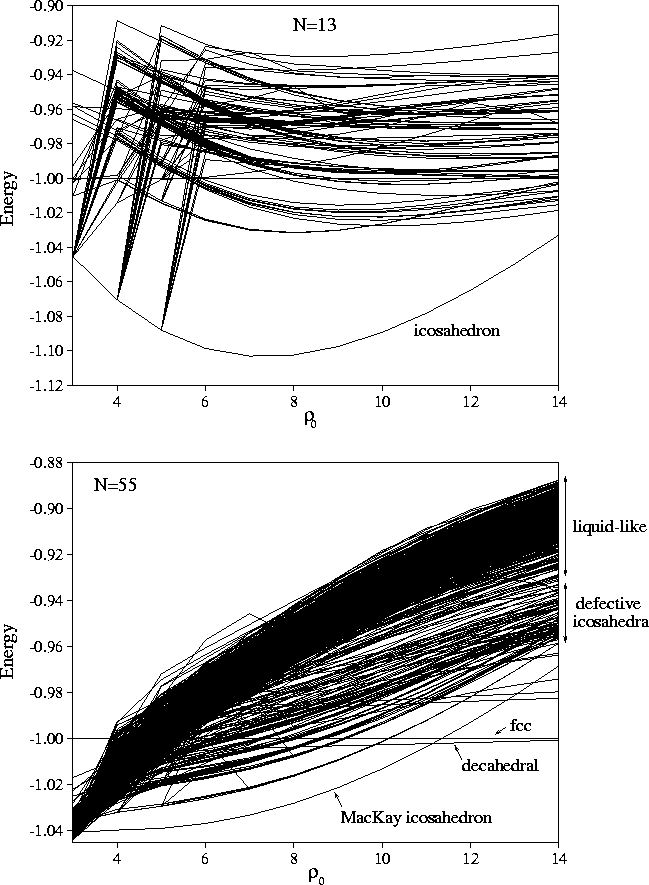
On changing ![]() a minimum may disappear from the PES.
When this occurs, geometry optimization leads to a new minimum and this
causes the discontinuities in the correlation diagrams (Figure 4.4).
This effect is particularly noticeable for the 13-atom cluster at long range,
because the total number of minima on the PES at
a minimum may disappear from the PES.
When this occurs, geometry optimization leads to a new minimum and this
causes the discontinuities in the correlation diagrams (Figure 4.4).
This effect is particularly noticeable for the 13-atom cluster at long range,
because the total number of minima on the PES at ![]() =3 is less than
the number of minima in our sample from
=3 is less than
the number of minima in our sample from ![]() =6 (Table 2.1).
=6 (Table 2.1).
 |
The lowest energy line in each correlation diagram at any given ![]() corresponds to the solid phase,
since at zero Kelvin this structure must have the lowest free energy.
For the bulk material (Figure 4.4), the lowest energy minimum is fcc for all values of
corresponds to the solid phase,
since at zero Kelvin this structure must have the lowest free energy.
For the bulk material (Figure 4.4), the lowest energy minimum is fcc for all values of ![]() .
However, as we saw in Chapter 2 the structure of the global minimum depends on
.
However, as we saw in Chapter 2 the structure of the global minimum depends on ![]() for clusters.
The global minima of M147 are illustrated in Figure 4.5,
and their energies and the ranges of
for clusters.
The global minima of M147 are illustrated in Figure 4.5,
and their energies and the ranges of ![]() for which they are the global minima are given in Table 4.1.
for which they are the global minima are given in Table 4.1.
| PG | nnn | ||||||||
| 147A | C1 | 729 | 97.629 | -1531.499 | -732.549 | -637.693 | -605.600 | 3.56 | |
| 147B | Ih | 696 | 26.896 | -1509.272 | -760.631 | -678.171 | -644.002 | 3.56 | 9.12 |
| 147C | Cs | 674 | 1.514 | -748.869 | -682.399 | -672.885 | 9.12 | 10.91 | |
| 147D | Cs | 674 | 1.495 | -748.598 | -682.386 | -672.911 | 10.91 | 18.88 147E |
In the correlation diagrams the relative slope of two lines is a measure of the difference in strain energies between two minima, a more positive slope implying a larger strain energy. For bulk material, the lowest energy lines above the fcc minimum are either close-packed structures misoriented with respect to the cubic box, or are based on the fcc minimum and contain defects such as vacancy-interstitial pairs. Both types of structure have a positive slope with respect to the perfect fcc structure, in the first case because the structure has to be sheared in order to fit into the box, and in the latter case because the interstitial defects introduce local strains. Although vacancies could be accommodated without any strain, the constant number and volume constraints used in this study only allow defects to be generated in pairs.
In contrast, the low energy lines in the cluster correlation diagrams run parallel to the line due to the icosahedral global minimum--a sign of their structural similarity. These lines are due to icosahedra with vacancies in the surface layer and adatoms on the surface. These minima give rise to the roughly equally-spaced peaks in the low energy region of the M55 and M147 probability distributions in Figure 4.3, and correspond to increasing numbers of defects. Rearrangements between these structures occur at energies just below that required for complete melting, leading to enhanced diffusion in the surface layer[110,111].
 |
The thick bands of lines with positive slope in the bulk, M55 and M147 correlation diagrams along with
the corresponding large, high energy peaks in the potential energy distributions (Figure 4.3)
are due to minima found by quenching from the region of phase space corresponding to liquid behaviour.
We have sampled only a tiny fraction of all these `liquid-like' minima;
for comparison, the number of minima corresponding to the liquid-like phase space
of M55 has been estimated as ![]() (§3.6).
It is because of this large configurational entropy and the greater vibrational entropy that the free energy of the
liquid phase usually becomes lower than that of the solid phase as the temperature increases, leading to melting.
For the bulk, the energy gap between these `liquid-like' minima and the fcc minimum clearly
increases with
(§3.6).
It is because of this large configurational entropy and the greater vibrational entropy that the free energy of the
liquid phase usually becomes lower than that of the solid phase as the temperature increases, leading to melting.
For the bulk, the energy gap between these `liquid-like' minima and the fcc minimum clearly
increases with ![]() (Figure 4.4). Thus, decreasing the range of the potential energetically
destabilizes the liquid phase. For the clusters the energy of the `liquid-like' minima must be compared to the energy
of the global minimum. As the decahedral and fcc structures which become global minima at short range
were not obtained in the sample of minima at
(Figure 4.4). Thus, decreasing the range of the potential energetically
destabilizes the liquid phase. For the clusters the energy of the `liquid-like' minima must be compared to the energy
of the global minimum. As the decahedral and fcc structures which become global minima at short range
were not obtained in the sample of minima at ![]() =6, the lines due to these structures have been added to
the correlation diagrams, although we have not added lines due to the many defective minima based upon them.
Hence, a similar result to bulk is seen for M55 and M147, i.e. the energy gap between the `liquid-like'
minima and the lowest energy solid structure, be it icosahedral or decahedral, clearly increases as
the range decreases (Figure 4.4).
=6, the lines due to these structures have been added to
the correlation diagrams, although we have not added lines due to the many defective minima based upon them.
Hence, a similar result to bulk is seen for M55 and M147, i.e. the energy gap between the `liquid-like'
minima and the lowest energy solid structure, be it icosahedral or decahedral, clearly increases as
the range decreases (Figure 4.4).
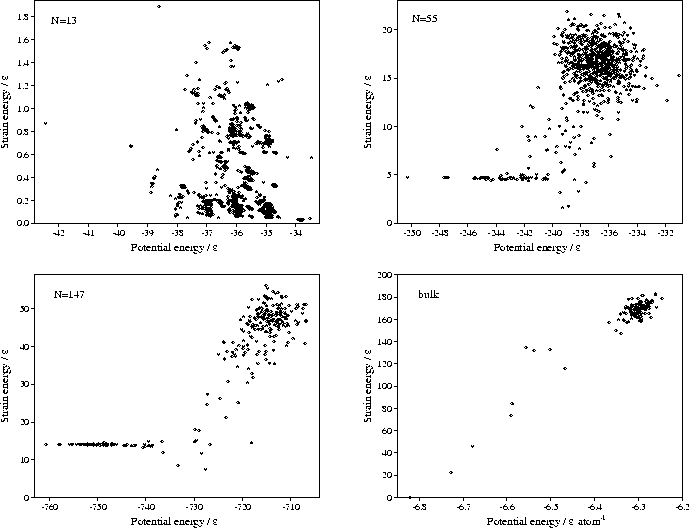
The physical basis for this behaviour is simply the greater strain energy of the `liquid-like' minima,
as shown by their positive slope in the correlation diagrams.
Figure 4.6 shows clearly the differentiation between the low potential energy, low strain energy
minima and the high potential energy, high strain energy `liquid-like' minima.
This greater strain arises from the inherent disorder of the `liquid-like' minima;
they have a range of nearest-neighbour distances, and consequently the first peak in the radial distribution
function is broader than for the solid. The strain energy is the energetic penalty for this
disorder and it rises rapidly as the range decreases and the potential wells narrow.
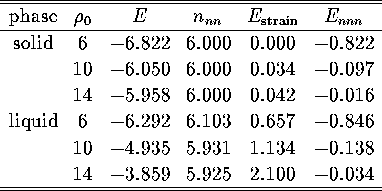
This view is confirmed by examining the three contributions to the energy for the
two bulk phases at different values of ![]() (Table 4.2).
The main contribution to the energy gap is found to be the larger
strain energy of the liquid minima.
This greater strain energy will be related to the
liquid structure in more detail in §4.4.
(Table 4.2).
The main contribution to the energy gap is found to be the larger
strain energy of the liquid minima.
This greater strain energy will be related to the
liquid structure in more detail in §4.4.
 |
The energetic destabilization of the liquid phase seen for bulk and the two larger clusters
gives rise to a term in the free energy difference between the solid and liquid phases which increases
rapidly with ![]() .
Since the energetics of the vapour phase can be assumed to be relatively unaffected
by the range of the potential, the rise in energy of the `liquid-like' minima with
.
Since the energetics of the vapour phase can be assumed to be relatively unaffected
by the range of the potential, the rise in energy of the `liquid-like' minima with ![]() for bulk and
the two larger clusters also causes the energy difference between the liquid and vapour to decrease.
Thus, the range-dependence of the energetics should have a large effect on the free energy differences both between
the solid and liquid phases and between the liquid and vapour phases, in both cases
destabilizing the liquid phase.
It is significantly harder to determine the range-dependence of the entropic contribution to
the free energy in our approach.
However, the entropy of the vapour phase should be relatively unaffected by
for bulk and
the two larger clusters also causes the energy difference between the liquid and vapour to decrease.
Thus, the range-dependence of the energetics should have a large effect on the free energy differences both between
the solid and liquid phases and between the liquid and vapour phases, in both cases
destabilizing the liquid phase.
It is significantly harder to determine the range-dependence of the entropic contribution to
the free energy in our approach.
However, the entropy of the vapour phase should be relatively unaffected by ![]() and
the entropy of both the solid and the liquid phases decreases as
and
the entropy of both the solid and the liquid phases decreases as ![]() increases due to the narrowing
of the potential wells and the attendant loss of accessible configuration space.
We have shown that the range-dependence of the energetics is sufficient to account for the known
range-dependence of the phase diagram and in particular the decrease of the critical temperature as the potential
becomes more short-ranged.
Thus, at least part of the destabilization of the liquid phase that
has been noted in experiments and simulations of colloids and can be traced to the PES in this way.
increases due to the narrowing
of the potential wells and the attendant loss of accessible configuration space.
We have shown that the range-dependence of the energetics is sufficient to account for the known
range-dependence of the phase diagram and in particular the decrease of the critical temperature as the potential
becomes more short-ranged.
Thus, at least part of the destabilization of the liquid phase that
has been noted in experiments and simulations of colloids and can be traced to the PES in this way.
The situation for M13 is rather different because of its small size--this cluster is nearer to the atomic limit.
The introduction of defects in the icosahedron involves an increase in the energy of
the cluster which is a significant fraction of the total potential energy.
The heat capacity peak found for LJ13 (it should exhibit very similar
behaviour to an M13 cluster with ![]() ) is associated with isomerization between the icosahedron and
the defective structures based upon it[128],
rather than between two phase-like forms that are structurally dissimilar.
The nature of the `melting' transition is therefore significantly different from the larger clusters
and from bulk.
As the removal of an atom from the vertex of the icosahedron allows relaxation of some of the strain,
the gap between the icosahedron and the defective states decreases as the range of the potential decreases.
) is associated with isomerization between the icosahedron and
the defective structures based upon it[128],
rather than between two phase-like forms that are structurally dissimilar.
The nature of the `melting' transition is therefore significantly different from the larger clusters
and from bulk.
As the removal of an atom from the vertex of the icosahedron allows relaxation of some of the strain,
the gap between the icosahedron and the defective states decreases as the range of the potential decreases.
There is another interesting effect evident in the correlation diagrams of M55 and M147:
as ![]() decreases the gap between the `liquid-like' band of minima and the Mackay icosahedron
decreases until for a sufficiently long-ranged potential the `liquid-like' band becomes lower in
energy than the icosahedron. At
decreases the gap between the `liquid-like' band of minima and the Mackay icosahedron
decreases until for a sufficiently long-ranged potential the `liquid-like' band becomes lower in
energy than the icosahedron. At ![]() for both M55 and M147, the lowest energy
clusters (55A and 147A) have an amorphous structure typical of the liquid-like state,
which as we saw in §2.3.4 can be analysed in terms of disclination lines.
for both M55 and M147, the lowest energy
clusters (55A and 147A) have an amorphous structure typical of the liquid-like state,
which as we saw in §2.3.4 can be analysed in terms of disclination lines.