Energy Landscapes of Biomolecules

My main area of interest is modelling polypeptides and (very!) small proteins using a version of the AMBER force field which I have coded myself. I have used several approaches to study the potential energy surfaces (PESs) produced, which I have summarised below.
 
Global Optimization

It is widely believed that the native conformation of a protein is the conformation with the lowest free energy, i.e. the global minimum of the free energy surface. This is known as Anfinsen's thermodynamic hypothesis. It is rather difficult (and expensive) to calculate free energies - by definition these involve averaging over a large number of conformations - so we instead concentrate on potential energies, making the assumption that the global free energy minimum should be a very low energy minimum on the PES, if not always the global minimum. Potential energies are functions only of atomic coordinates and are thus much easier to calculate. Efficient algorithms for global optimization of the PES should therefore be very useful tools for protein structure prediction. 

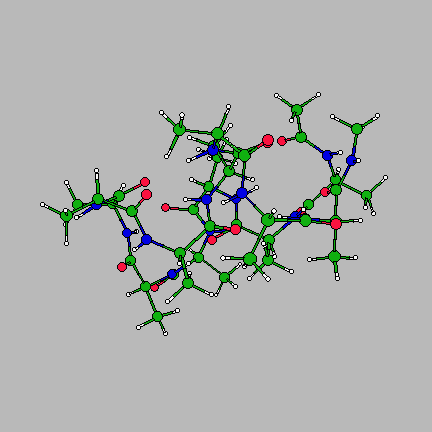
The image on the right is of the global minimum for Ac-(ala)14-NHMe using the AMBER95 force field with a dielctric constant of 1. This was located using the basin-hopping algorithm of Wales and Doye (incorporated in the program GMIN), which is essentially the Monte-Carlo with Minimization algorithm of Scheraga and Li. Recently I have been working on a parallel "taboo" algorithm, where several basin-hopping runs are set in motion at once. If any run gets too close in conformation space to another run, its coordinates are randomly reseeded. The algorithm thus attempts to maximise the volume of conformation space which is explored, while at the same time allowing each individual run to explore its area of conformation space thoroughly.

Click here for a list of (what I believe to be) global minima for some poly-(L)-alanine chains and their structures.
 
 
Exploration and visualization of the landscape

Although locating the global minimum is of prime importance when looking at a PES, it by no means tells us everything about the system of interest. It is possible for example that the system actually does not reside in its lowest energy state for kinetic reasons, and it has been suggested recently that some larger proteins may only be kinetically stable. A characterization of the PES for a system can help to explain these phenomena. In order to achieve this we need not only to obtain a large sample of minima, but also the transition states which link them. I have used variaions of the Eigenvector-Following method (contained within the program OPTIM2) to locate transition states and connected minima for various small polypeptides. 

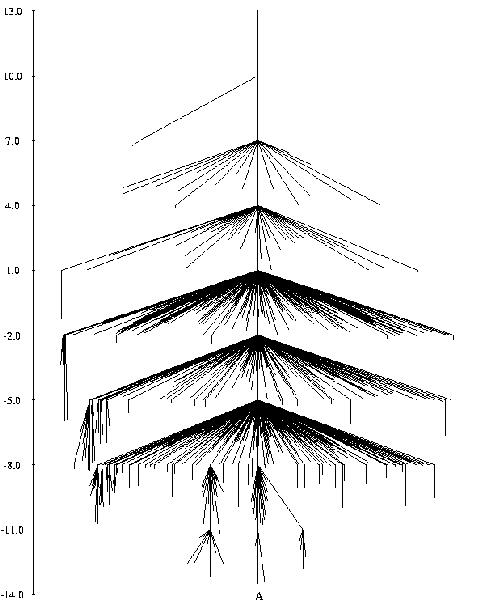
The landscape itself is a 3N+1 dimensional object, where N is the number of atoms, so it is very difficult to visualize. One solution to this problem comes in the form of the disconnectivity graph as shown on the left. These were first used by Becker and Karplus to visualize the landscape of a small tetrapeptide, Iso-butyryl-(ala)3-NHMe (IAN). 

For an description of how to read disconnectivity graphs, click here. The graph on the left is one which I generated for IAN using the AMBER95 force field, with a dielectric constant of 1. The landscape is discussed in our review paper which is awaiting publication in "Advances in Chemical Physics". For a slightly larger and clearer version of this graph, click here.


Thermodynamic properties of model systems

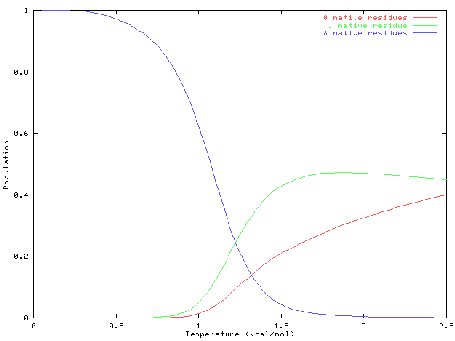
Having obtained a large and hopefully representative sample of minima and transition states, we can calculate approximate thermodynamic properties of the system. For example, we can calculate an approximate partition function for the system as a sum of contributions from each stable conformation, or minimum, and use this to calculate equlilbrium populations at various temperatures for individual minima or groups of minima. 

The graph on the right is an example of this. The system in this case is Ac-(ala)8-NHMe with a distance-dependent dielectric constant. The global minimum for this system is an alpha-helix. For an explanation of the graph, and a clearer version of it, click here.


Master equation dynamics

Using the same approximate partition function as above, we can also calculate rate constants for each pathway (i.e. transition state and two connected minima). We can use these to observe the evolution over time of the system, in terms of the probability of the system being in a particular conformation at a specified time. Starting from a high temperature equilibrium distribution, where the probability of the system being in any one minimum is very low (entropically dominated), we can watch as the system "relaxes" and probability gradually accumulates in low energy minima. Eventually (if the global potential energy minimum is also the free energy minimum at the temperature of interest) the most probably occupied state will be the global minimum, or a collection of states similar to it.

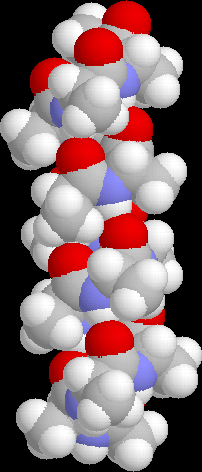
We can also construct folding pathways using our database of minima and transition states. The image on the left is of Ac-(ala)12NHMe in a compact conformation. Click here to see it fold into an alpha-helix (file is approximately 220k).

Publications

Energy Landscapes of Clusters, Biomolecules and Solids - D. J. Wales, J. P. K. Doye, M. A. Miller, P. N. Mortenson and T. R. Walsh; Advances in Chemical Physics, 115, 1 (2000)

Energy Landscapes, Global Optimization and Dynamics of the Model Polypeptide Ac-(ala)8-NHMe - P. N. Mortenson and D. J. Wales
Awaiting publication in the Journal of Chemical Physics.
 

Software

I have coded the AMBER95 potential with analytical first and second derivatives for both GMIN and OPTIM2. I have also coded a parallel landscape searching algorithm, known as Filthy_Phyllis.