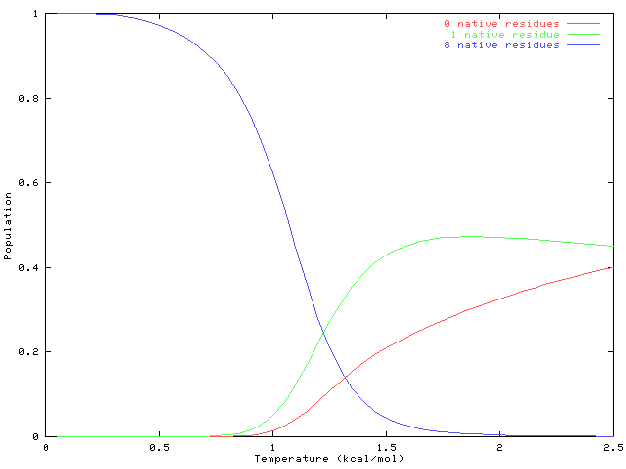
This graph shows the fractional equlibrium populations of three groups of minima as functions of temperature in kcal/mol. For those of you not used to measuring temperature in these units, 300K is roughly 0.6kcal/mol. The minima have been grouped according to the maximum number of consecutive native residues they contain. A residue is defined as native if both backbone dihedral angles are within 30 degrees of the global minimum values. The blue line corresponds to the six minima with eight native residues, so this sample contains the global minimum. The red line corresponds to the 674 minima with no native residues, and the green line represents the 2,803 minima we found with one native residue. As expected, at low temperatures the native and near-native states are the most heavily populated, and as the temperature increases then higher energy minima become populated, and the distribution bcomes a lot more even. At 300K, roughly 95% of the sample lies in one of the six "blue" minima.